Olympics 2024: Uncovering Insights 🏅
As a fan of the Olympics and of sports in general, I’ve often wondered what makes winners winners? Is it purely down to their performance on the day? Or are there certain aspects, like their height or mindset, that give them an edge? In this blog, I’m diving into some datasets I found on Kaggle to see if I can uncover any hidden patterns or factors that might explain what sets Olympic medallists apart. Let’s see what the data reveals ….
In this analysis, I will explore:
- Medal Distribution: Analysing how medals are distributed by type and country.
- Gender Representation: Examining the gender distribution among athletes.
- Top Performers: Highlighting the medal counts of the leading athletes.
- Age and Performance: Investigating how age influences athletic success.
- Logistic Regression: Identifying key features that enhance the likelihood of success.
- NLP Analysis: Exploring hobbies and philosophies of athletes to uncover common traits.
Overall Medal Leaderboard: Tableau Dashboard
Below is an interactive Tableau dashboard that showcases overall medal distribution across all countries. Use this dashboard to gain preliminary insights into the 2024 Olympics:
Note: AIN stands for “Individual Neutral Athletes,” or “Athlètes Individuels Neutres” in French [2]. This refers to athletes from Russia and Belarus who compete under a neutral flag rather than representing their home countries.
Gender Distribution
The Paris 2024 Olympics made history in terms of gender parity with women athletes having as many places in the Games as male athletes [3]. In this section, I will dive into the gender representation among athletes, exploring its trends and outcomes.
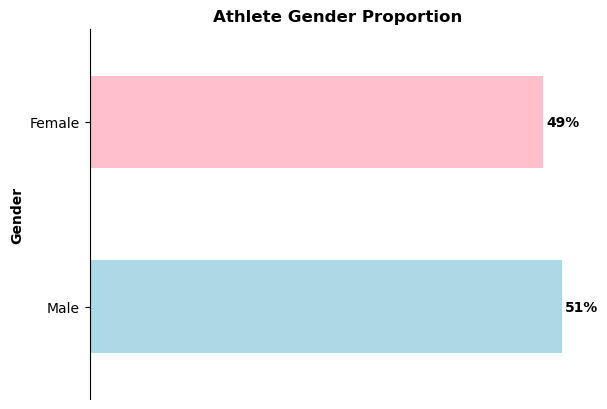
Athlete Gender Proportion: The dataset I’m analysing reflects an almost perfect gender balance, with 49% female and 51% male athletes. Now, let’s explore whether this parity extends to the medallists as well.
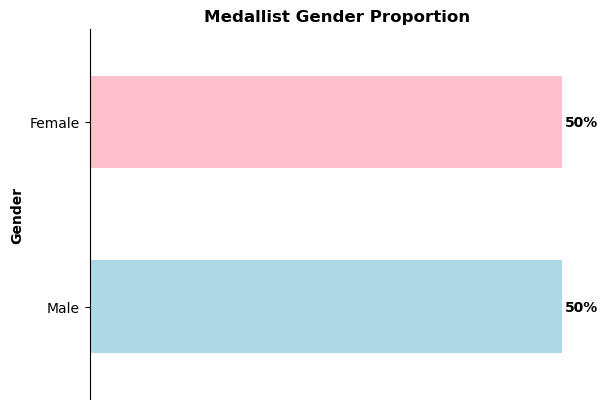
Medallist Gender Proportion: The data also reveals an even gender balance among the medallists, with a 50/50 split between female and male athletes.
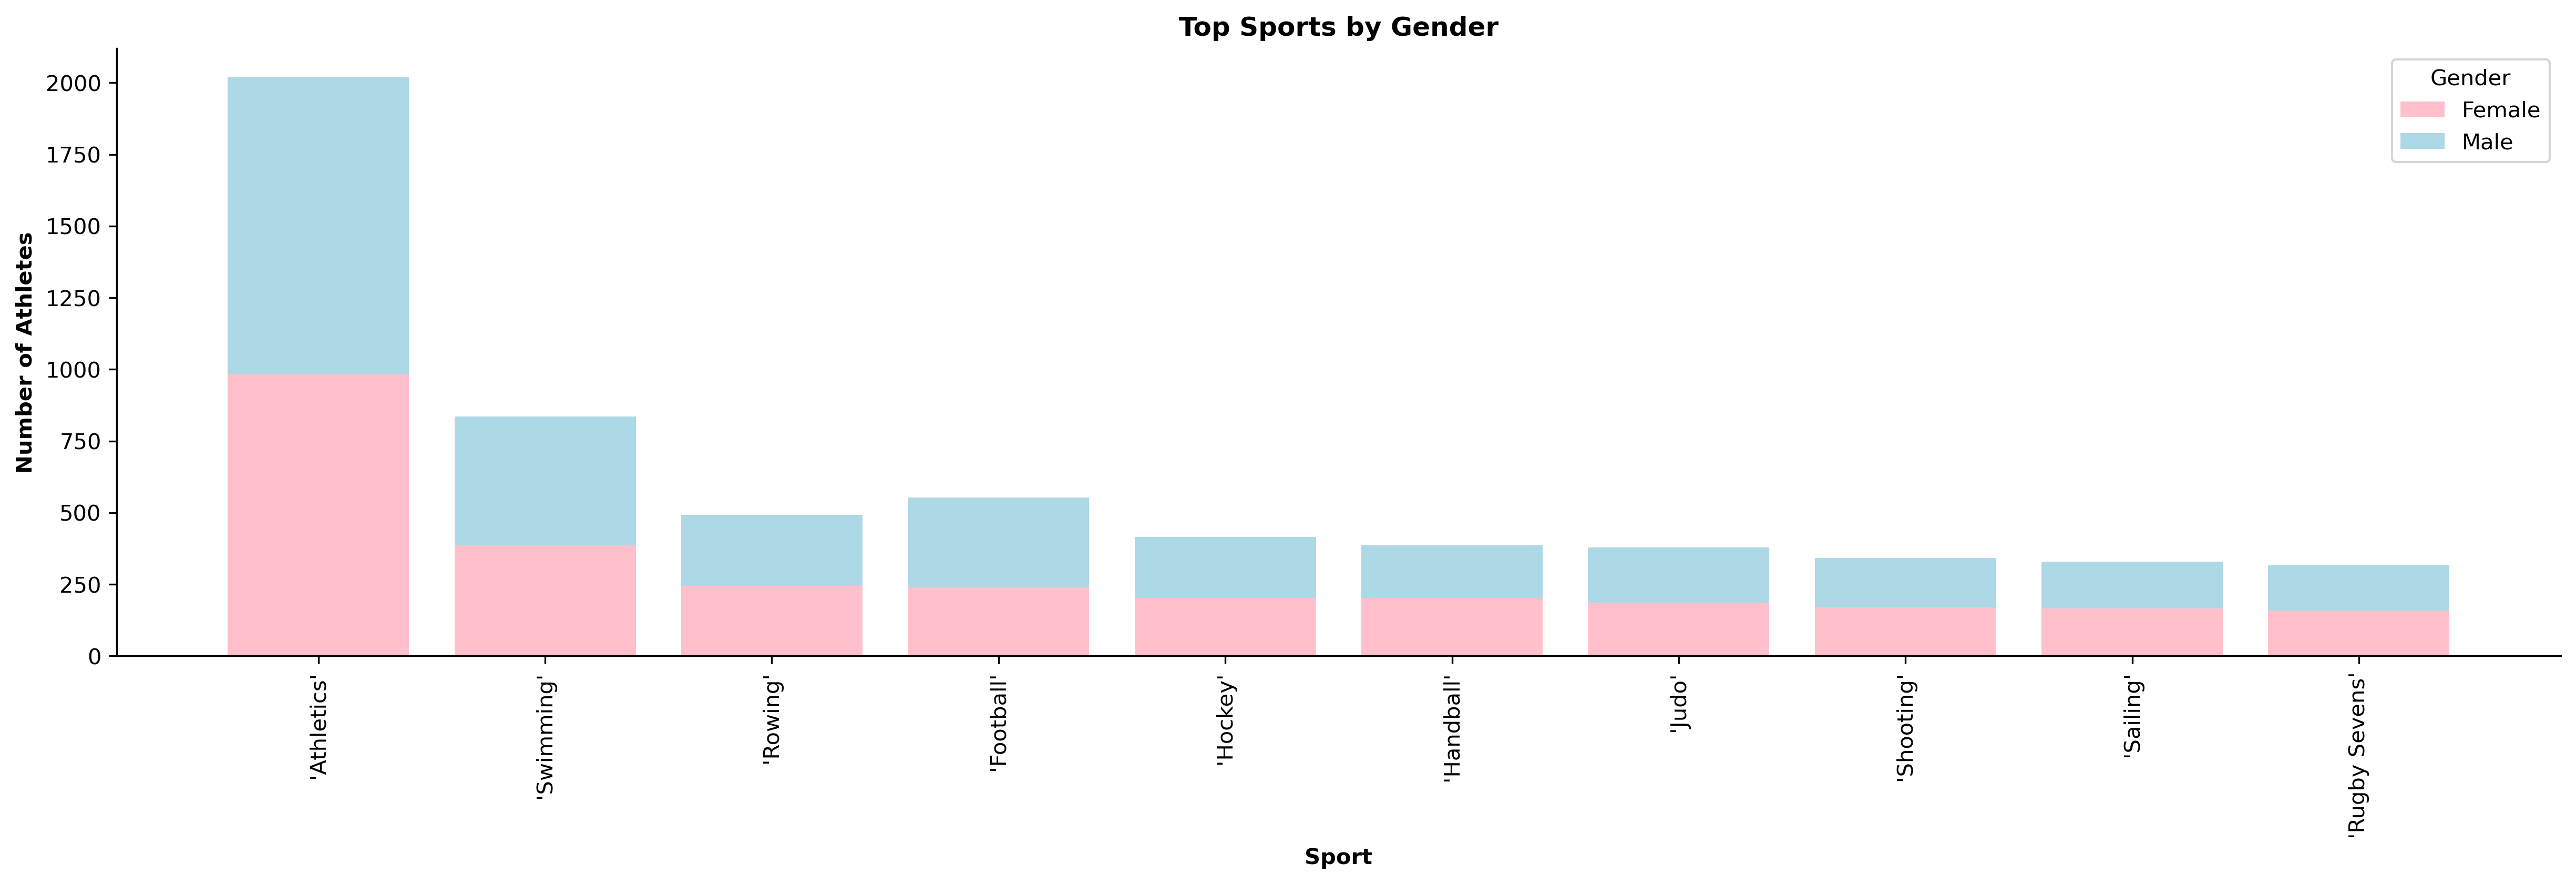
Top Sports by Gender: The data highlights that while overall gender representation is balanced, certain sports still show uneven representation. Some sports show a slightly strong skew towards one gender such as swimming and football.
Top Performing Athletes
Key insights:

- Torri Huske and Leon Marchand dominate with multiple gold medals.
- Regan Smith stands out with a strong collection of silver medals.
- Zhang Yufei’s achievement is particularly impressive, with five bronze medals and one silver medal, demonstrating an ability to perform at a high level across various events.
Age and Performance
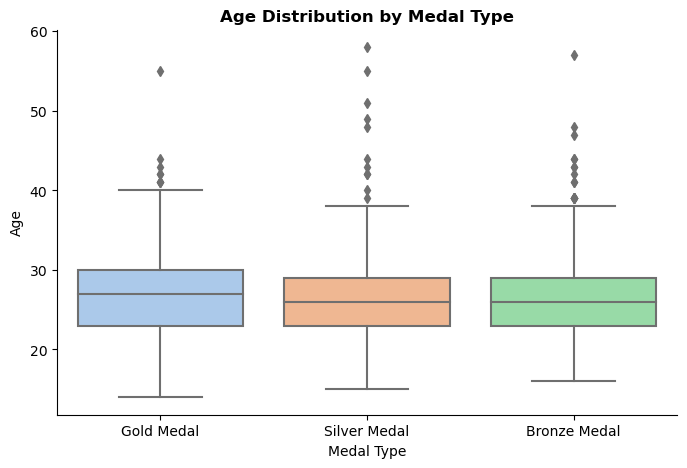
Age Distribution by Medal Type:
- Gold Medals: Gold medallists typically range from ages 23 to 30. The age distribution is relatively consistent with fewer outliers compared to silver and bronze medals.
- Silver Medals: Silver medallists are mainly between 23 and 28 years old. There are more outliers in this category, suggesting some variability.
- Bronze Medals: Bronze medallists also show a concentration between 23 and 28 years, like silver medals.
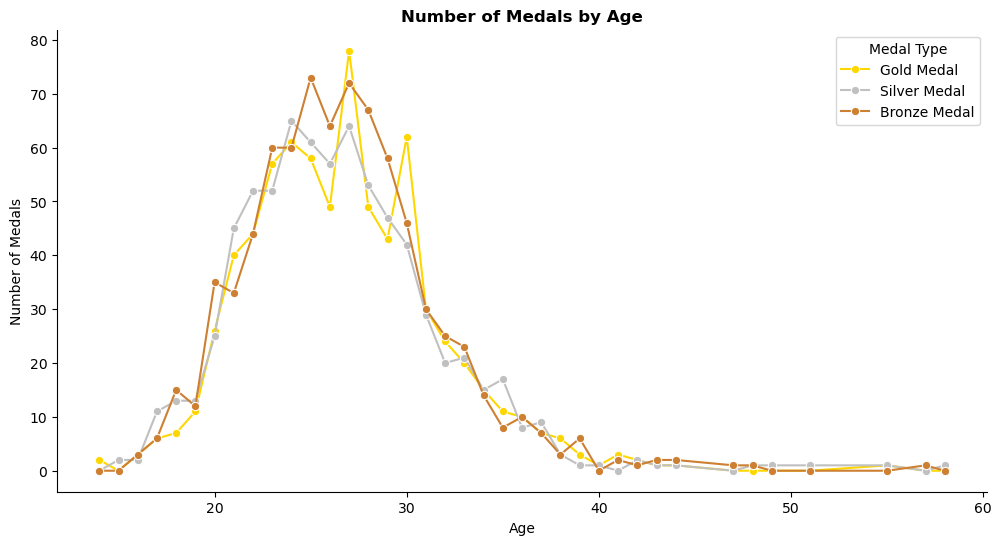
Number of Medals by Age:
- Peak Performance Age: The line graph reveals that athletes tend to peak in their medal counts in their late 20s. This is consistent across gold, silver and bronze medals, indicating that this age range is optimal for peak performance.
- Post-Peak Decline: After reaching their peak in the late 20s, there is a noticeable decline in medal counts for silver and bronze medals in older age groups. This trend suggests that performance in these categories tends to decrease as athletes age.
- Gold Medallists Secondary Peak: Interestingly, gold medal counts show a smaller peak around age 30. This indicates that while the general trend is a decline after the late 20s, some athletes continue to achieve high performance and secure gold medals into their 30s. This trend may reflect results of some sports which benefit from greater experience and expertise.
Logistic Regression Results
So, what exactly is Logistic Regression?
Logistic Regression is a classification algorithm used to predict the probability of a binary outcome. A binary outcome refers to a situation where only two results are possible - in this case, Win/Lose. For this analysis, I consider any medallists as a winner.
Logistic Regression uses independent variables (called features) to predict the likelihood of a specific outcome. In this analysis, I use features such as an athlete’s age and height to predict the probability of an athlete winning a medal.
How does Logistic Regression work?
Logistic Regression works by finding a decision boundary which best separates the two binary outcomes.
Let’s take a look at a simple example:

Here, we are looking at how a single feature, height, affects the probability of an athlete winning a medal.
The S-shaped curved (called sigmoid curve) shows predicted probability of winning medal for different heights. It is clear that as height increases, the chance of winning a medal also increases.
The decision boundary represents a threshold to determine if an athlete will win a medal. If the predicted probability is less than 0.5 (50%) the model predicts the athlete is not likely to win a medal. Likewise, if the predicted probability is above 0.5 then the model predicts the athlete is likely to win a medal.
The logistic regression model uses the sigmoid curve in estimate the probability of an athlete’s success based on their height. The decision boundary is used to help make predictions by providing a clear cutoff point for classifying an athletes as winners.
Note: When dealing with multiple features, the decision boundary becomes more complex than a single line and is represented as a multidimensional plane. The graph above illustrates the fundamental concepts of logistic regression with a single feature.
How is it done?
First, I took some pre-processing steps to ensure the data was suitable for the logistic regression model:
Step 1: Feature Engineering
Feature engineering is the process of creating and modifying existing features to provide additional insights and modify data to better suit the model.
- Sporting Relatives: Original column was text based, describing a variety of relationships to the athlete. To me, the purpose of this column was to clarify if an athlete had a sporting relative. Therefore, I transformed this column to a Boolean data type to simplify the model without losing significant insight.
- Winning Athletes: A new column was added to indicate whether an athlete won any medals. This will be my target variable and the outcome I will predict.
- Age: Calculated from athletes’ birthdates, the age column was included to assess how age influences performance.
- Other Sports: Initially a messy column with full sentences, was cleaned using regular expressions to extract only the sport names.
- Plays Other Sports: A simple boolean column indicating whether an athlete plays additional sports.
- Has Ritual: Converted values from the ‘ritual’ column to a boolean value to indicate whether an athlete has a pre-race ritual.
Step 2: Feature Selection
In selecting features for the logistic regression model, the following considerations were made:
- Relevance to Outcome: Features directly related to athletic success, such as age and sporting relatives, were retained for their potential impact.
- Avoiding Data Explosion: Features like events and education were excluded due to their high diversity of unique values which could potentially overly complicate the model.
- Handling Missing Data: Weight column was dropped due to a high proportion of missing values and values which were 0.
- Future Analysis: Features like hobbies and philosophy were reserved for later, where I apply NLP.
Step 3: Data Cleaning
- Null Values: The dataset was cleaned to ensure no null values remained.
- Height Values: Zero values in the ‘height’ column were replaced with the mean height based on gender to maintain accuracy.
Logistic Regression Steps:
1. Conversion to Numerical: Categorical variables were converted to numerical values since all values must be numerical.
2. Scaling: Features were scaled to standardise their ranges. This step ensures that no single feature over influences the model due to differences in scale.
3. Splitting Data: The dataset was divided into feature variables (X) and the target variable (Y).
4. Building and Fitting the Model: The logistic regression model was instantiated and trained using the processed data.
5. Assessing Accuracy: The model’s accuracy was evaluated to determine its effectiveness in predicting outcomes.
6. Evaluating Coefficients and Odds Ratios: The model coefficients and odds ratios were analysed to understand the impact each feature had on the likelihood of success.
The table below summarizes the results of our logistic regression analysis, showing the coefficients and odds ratios for each feature:
| Feature | Coefficient | Odds Ratio |
|---|---|---|
| Play Other Sports | 0.361081 | 1.434879 |
| Sporting Relatives | 0.357770 | 1.430136 |
| Scaled Height | 0.273702 | 1.314823 |
| Has Ritual | 0.254909 | 1.290344 |
| Scaled Age | 0.018152 | 1.018317 |
| Gender Encoded | -0.294429 | 0.744957 |
Interpretation
- Play Other Sports: Athletes involved in various sports are 43.5% more likely to succeed compared to those who focus on just one sport.
-
Sporting Relatives: Having relatives involved in sports also positively affects success, increasing the odds of winning by 43%.
-
Scaled Height: Height positively impacts the likelihood of success, per unit increase in height, the likelihood of success increases by 31.5%.
-
Has Ritual: Athletes who have pre-race rituals are 29% more likely to win, possibly due to increased confidence.
-
Scaled Age: Each additional year slightly increases the chance of winning by about 1.8%, but this effect is relatively small. This could be due to performance peaking at a certain age and then declining which balances out the overall effect of age over time.
- Gender Encoded: The negative coefficient for gender indicates that being male decreases the likelihood of success by 25.5%. Within this data, male athletes have a slightly lower probability of winning compared to female athletes.
NOTE: To build this model, I removed a significant amount of null data. This removal process might have introduced some bias into the dataset, potentially affecting the model’s overall accuracy and interpretations. For instance, the lower likelihood of success for males observed in the model might be influenced by this bias. Despite a 50/50 split in medallists between genders in the overall dataset, the reduced dataset may not accurately represent this balance.
NLP Analysis
To enhance my analysis, I applied NLP techniques to include hobbies of athletes. Here’s a basic overview of the process:
Text Processing: Using NLP, I split and cleaned the text to identify and categorise specific hobbies.
Feature Creation: I converted the categorised hobbies into new features for the logistic regression model.
Model Update: I reran the logistic regression model to see which hobbies influenced the likelihood of success.
This approach allowed me to assess which hobbies contributed to an athlete’s success.
Note: I will be covering the process and fundamentals of NLP in a future post!
Top Hobbies Contributing to Success
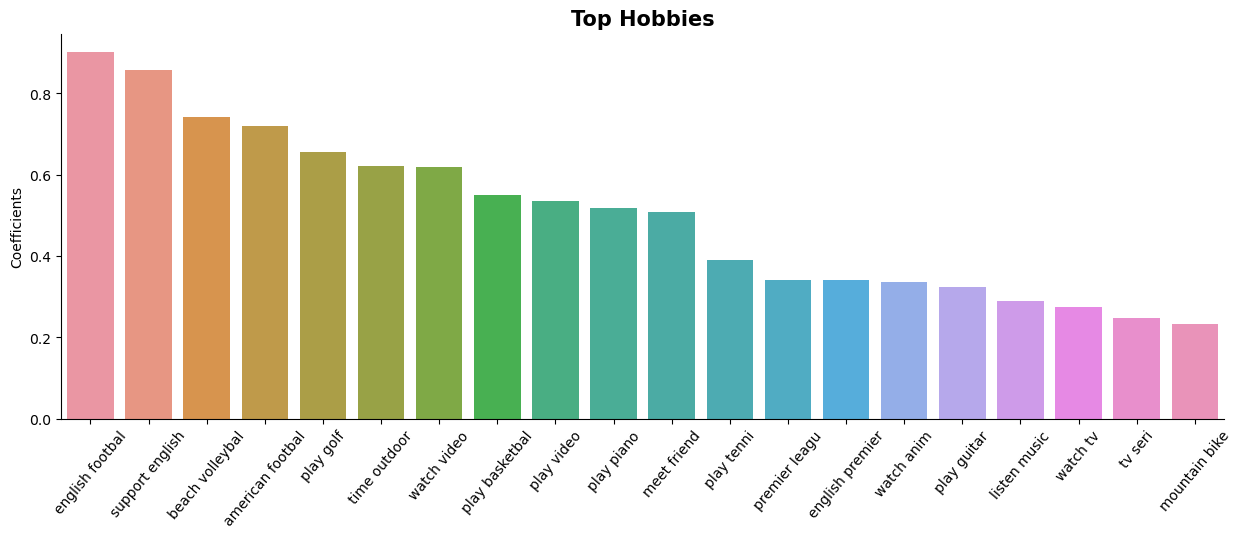
Key Insights:
1. Dominance of Sports:
- Football (Including Soccer and American Football): The highest coefficients are associated with football-related activities. “English football” and “supporting English football” rank at the top, highlighting a significant interest in this sport among medallists.
- Other Sports: Golf, beach volleyball, basketball and tennis also appear on the list, indicating that medallists not only enjoy watching these sports but also actively participate in them.
Sporting hobbies keep medallists physically fit but also build upon their competitive spirit. All sports require discipline and teamwork both of which are key in the Olympic Games.
2. Video Interests:
- Video Content: “Watching video,” “watching anime,” “watching TV,” and following TV series are hobbies with higher coefficients.
Watching content, sport or not, can be a form of relaxation. This can help athletes to unwind and relax, both are important mentally before competing.
3. Musical Interests:
- Playing Instruments: Playing the piano and guitar are among the top hobbies. Music can also act as a form of relaxation offering balance to their intense physical training.
- Listening to Music: Similarly, listening to music ranks high.
4. Outdoor and Social Activities:
- Outdoor Time and Mountain Biking: Activities like spending time outdoors and mountain biking show that medallists enjoy staying active even outside of their professional training.
- Social Activities: Meeting friends is also a common hobby, suggesting that despite their demanding schedules, medallists prioritise time with peers/family.
5. Video Games:
- Playing Video Games: Video games may provide a mental break or a way to engage in a competitive environment outside of their professional sports.
Top Phrases in Winning Athletes’ Philosophies
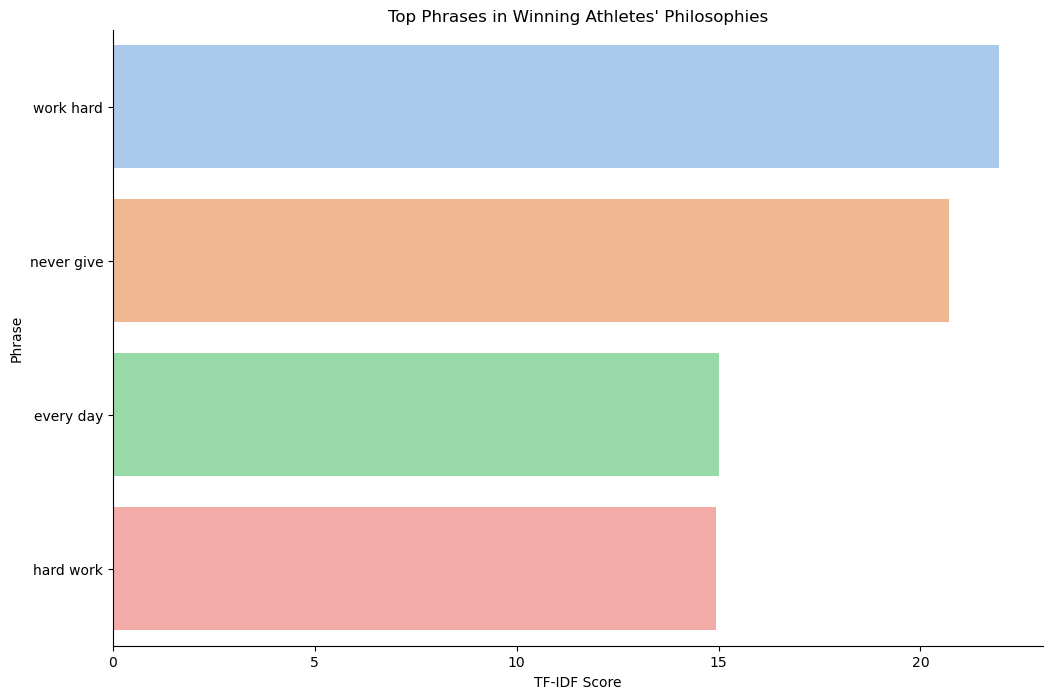
The phrases ‘work hard,’, ‘never give,’, ‘every day,’ and ‘hard work’ are among the top phrases in the philosophies of winning athletes.
- ‘Work hard’ and ‘hard work’: Reflect a commitment to putting in effort.
- ‘Never give’: Assume this to be never give up, highlights the resilience and determination of athletes.
- ‘Every day’: Emphasises the importance of consistent daily effort.
These phrases capture the core philosophies that drive athletes to achieve success. Perhaps combining these phrases into a single philosophy could be the key to guaranteeing success!
Summary
To ensure the most reliable results in modelling, thorough data cleaning is important.
In my analysis, I faced a considerable amount of null data, which is common when collecting detailed personal information such as hobbies and rituals. Given that this sort of data can be time-consuming to fill in, missing values were expected. I decided to remove all rows with missing data, despite the significant reduction in dataset size as to me it was essential to ensure models were based on complete information.
In the future, if I was to collect data about athletes, I would encourage them to provide more detailed information by:
1. Incentives: Offering rewards such as access to exclusive training resources and financial incentives to motivate athletes to share more data.
2. Confidentiality: Ensuring that all personal data is handled with confidentiality and explaining how the data will be used to benefit their performance or career.
3. Highlighting Benefits: Explain how detailed data can improve the accuracy of performance analysis and insights, leading to better understanding on patterns and trends identified in the data.
Throughout this post, I have explored various aspects of Olympic success. I analysed the distribution of medals across countries, explored gender representation and assessed the achievements of top performers. Additionally, I used logistic regression to identify key factors that contribute to success and used NLP to reveal how common hobbies impact the success of athletes.
Appendix
[1] Kaggle Link: https://www.kaggle.com/datasets/sajkazmi/paris-olympics-2024-games-dataset-updated-daily/data
[2] https://www.cbsnews.com/news/what-is-ain-olympics-russia-belarus/
[3] https://www.weforum.org/agenda/2024/04/paris-olympics-2024-gender-parity/