Sound Decisions: EDA 🔍
In Part 1 of the Sound Decisions series, I introduced web scraping, discussed its relevance and demonstrated how to scrape data. I also walked through the process of cleaning the scraped data and extracting features from product descriptions to enhance the dataset.
In this post, I’ll showcase an interactive dashboard built using Tableau to better visualise the data. I’ll also explore some further insights to better understand the data before moving on to building a recommendation system.
Dashboard
To better visualise the scraped data, I created an interactive dashboard. The goal was to gain preliminary insights into the data and quickly explore relationships or patterns between features. This dashboard provided a helpful visual snapshot of the data before moving on to a more in-depth EDA.
KPI’s
Total Products
This KPI displays the total number of headphones in the dataset, giving us an idea on the overall scope of the scraped data. After scraping 50 pages on Amazon, I collected data on 478 different headphone products which should give a fair representation of the headphone market.
Average Price
Shows the average price of all headphones in the dataset. Coupled with the price distribution graph, it is clear there is a skew towards cheaper headphones suggesting the market on Amazon is dominated by lower-priced headphones. This could be an issue as there is an under-representation of premium headphones in the dataset.
Average Rating
Displays the average user rating for all headphones in the dataset. Again, this shows skewness towards the positive rated headphones.
Interactive Filters:
Headphone Features
Able to filter all dashboard elements to display data only on headphones which have certain features like microphone or noise cancelling. By applying these filters, insights can be tailored to see impact specific features has on price or rating.
Colour
Similar to headphone features, all dashboard elements can be filtered to only show headphones with specific colours.
Graph 1: Rating of Headphone Features on a Scale of 1 to 5
This horizontal bar chart shows the overall average rating of headphones which have a specific feature.
However, it’s important to note that many headphones in the dataset have multiple features. Therefore, the average rating of each single feature could be influenced by the presence of other features in the same product. This graph still provides a useful overview of how features correlate with ratings, but the exact contribution of each single feature may not be fully isolated.
Graph 2: Distribution of Price
This graph shows the price distribution across all headphones. It’s clear that most of the products are skewed towards the lower end of the price range. This insight shows bias in the dataset and will likely affect the following stages of the project.
Graph 3: Top 10 Rated Headphones
Highlights the top 10 rated headphones in the dataset, showing both their product ID and price.
Overall, the Tableau dashboard provided some insights, but these findings are somewhat limited. Further EDA is necessary to uncover deeper insights and patterns, as well as to address the skewness and biases present in the data. This additional analysis will help in building a more effective recommender system.
Further Insights
After gaining insights from the Tableau dashboard, I carried out a more detailed EDA. First, I performed univariate analysis to examine each feature individually. Then, I moved to multivariate analysis to explore how the features relate to one another.
Note: I will only discuss the graphs and insights that provide the most value, for all insights please refer to the project repository (to be provided when project is complete).
Univariate Analysis
Price:
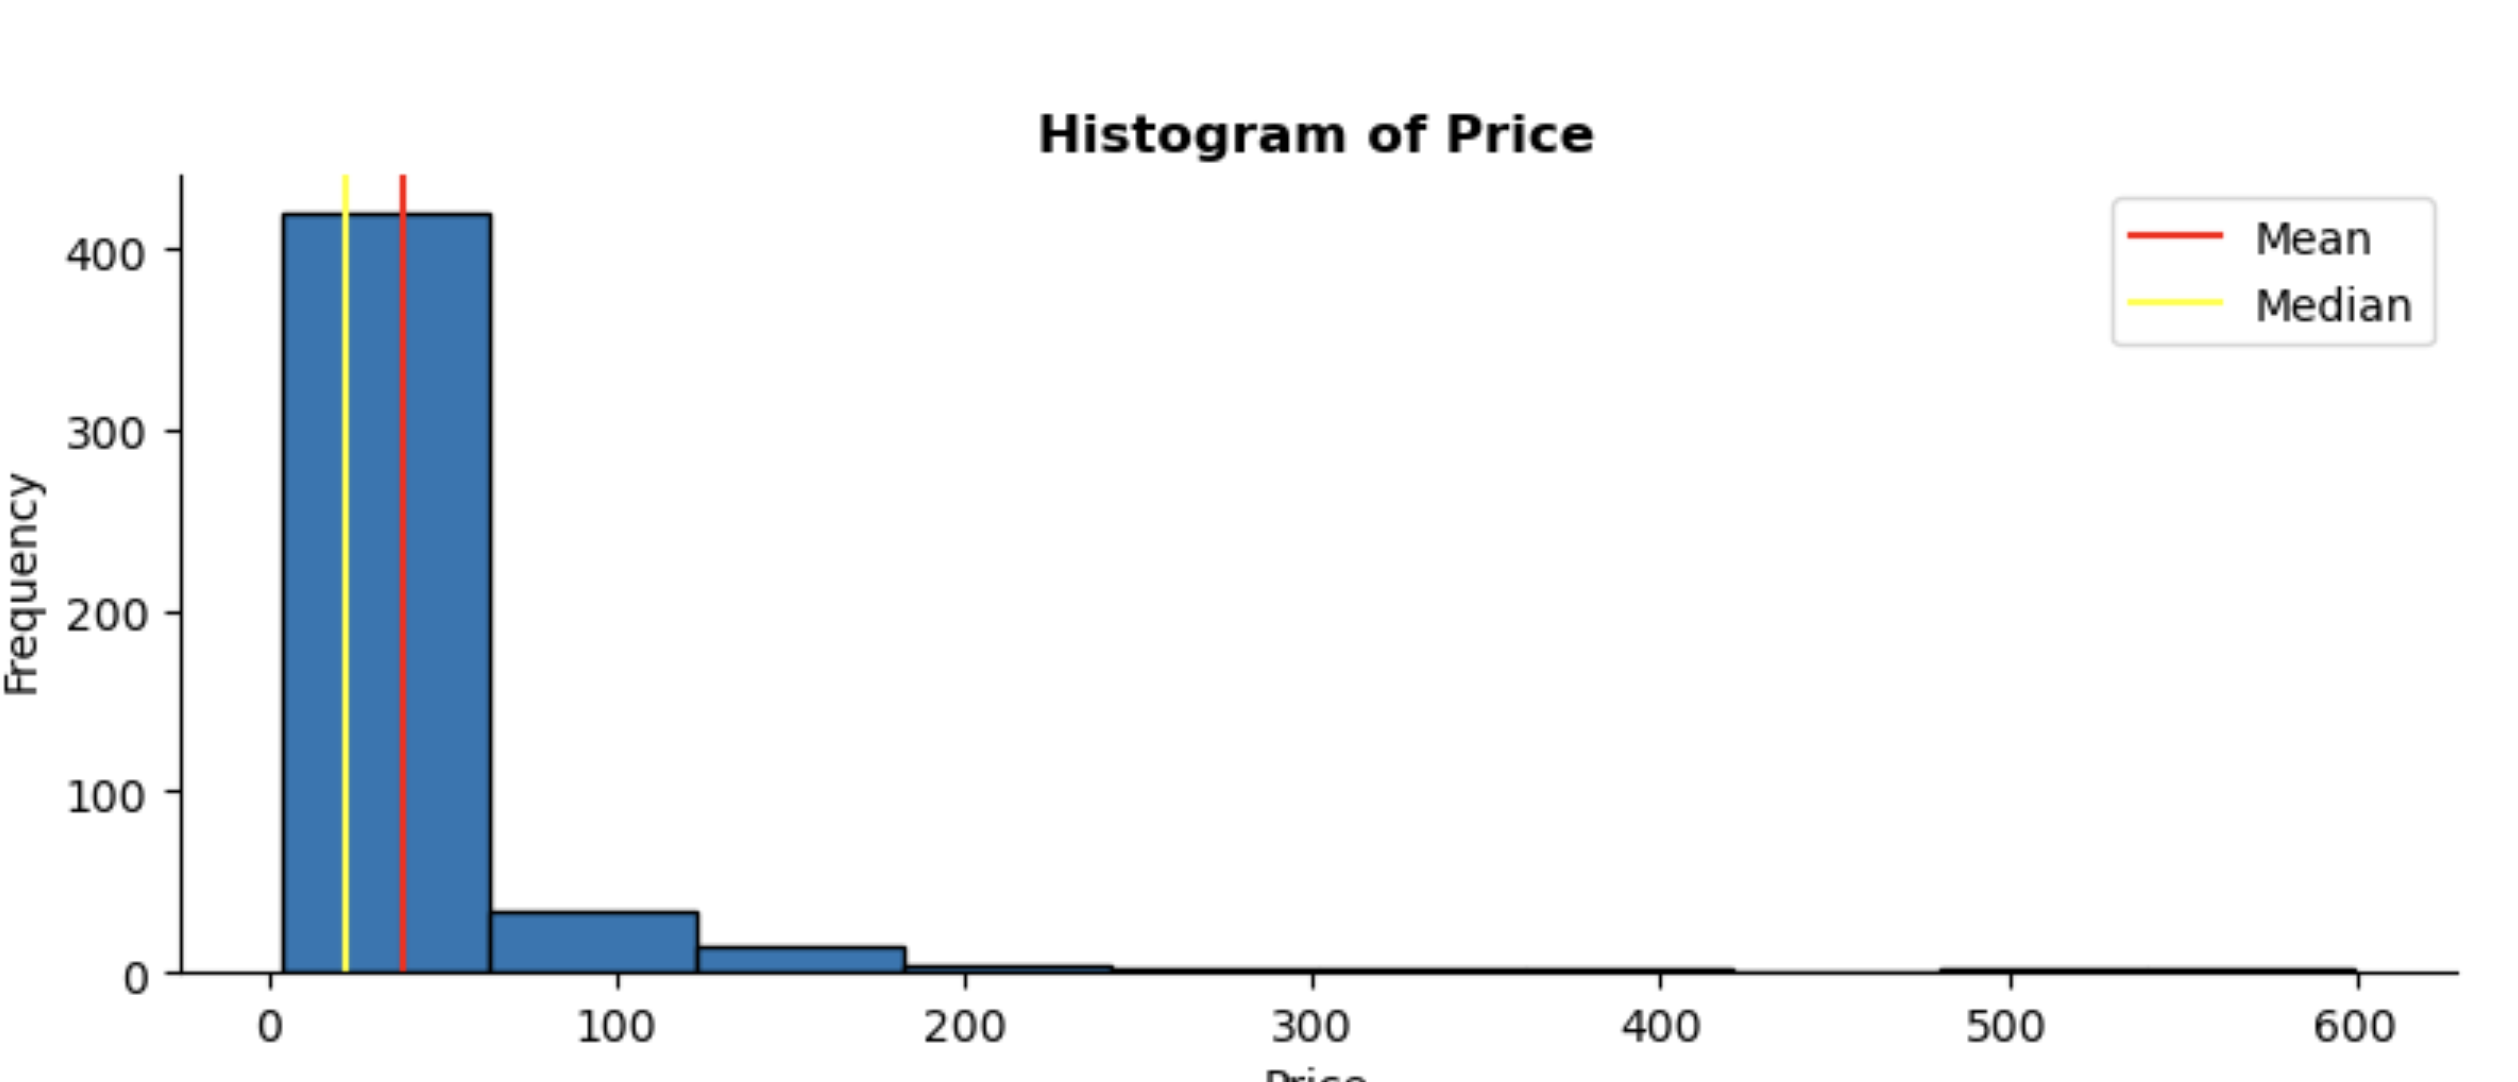
The price distribution is skewed to the right, which means there is a higher concentration of lower priced headphones. Given that I scraped data from 50 pages of search results, this skewness likely reflects the broader market of headphones on Amazon.
To handle this skewness and normalise the distribution, I applied a log transformation to price. This step is important as the next phase of the project involves modelling. Many models work under the assumption that all data points follow a similar distribution. Normalising the price feature will help improve the model’s performance and accuracy.
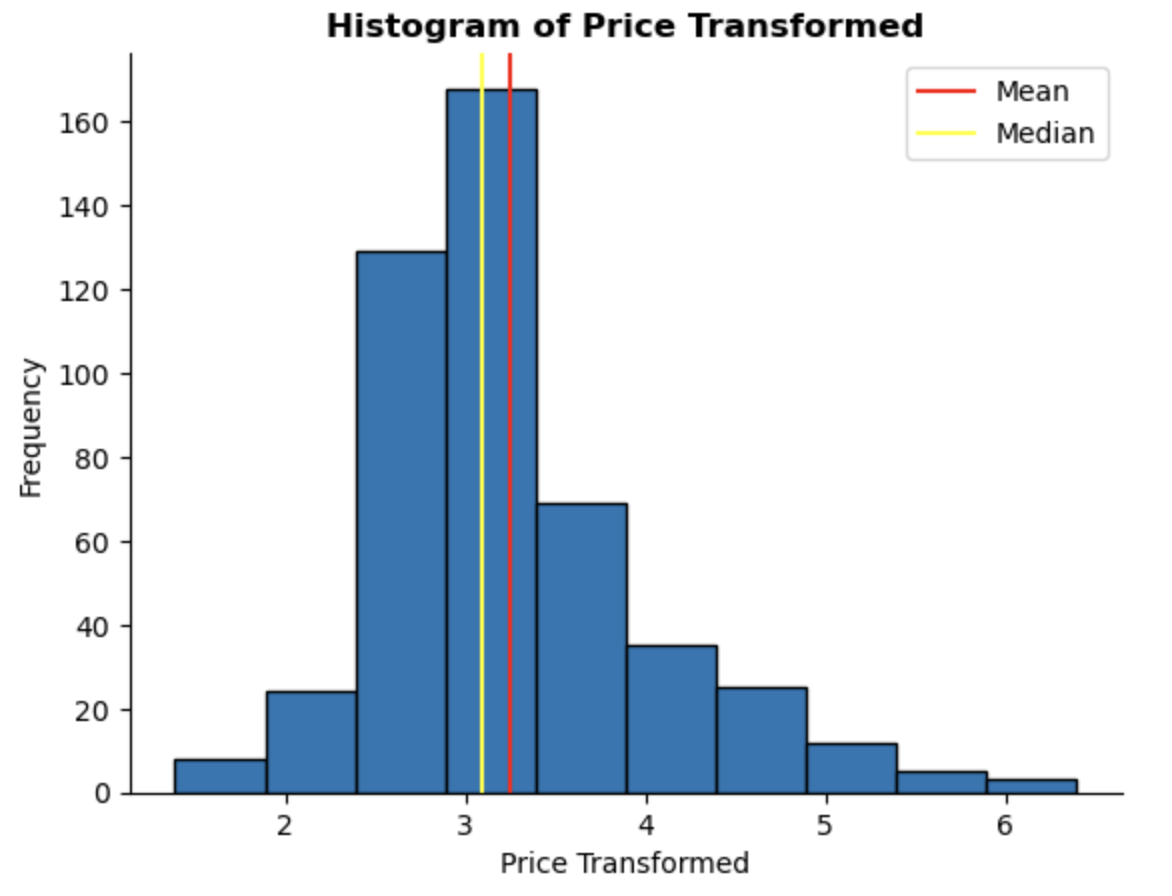
Applying the log transformation has made the distribution of price more normal. Moving forward, I will use the log-transformed price instead of the original price.
Rating:
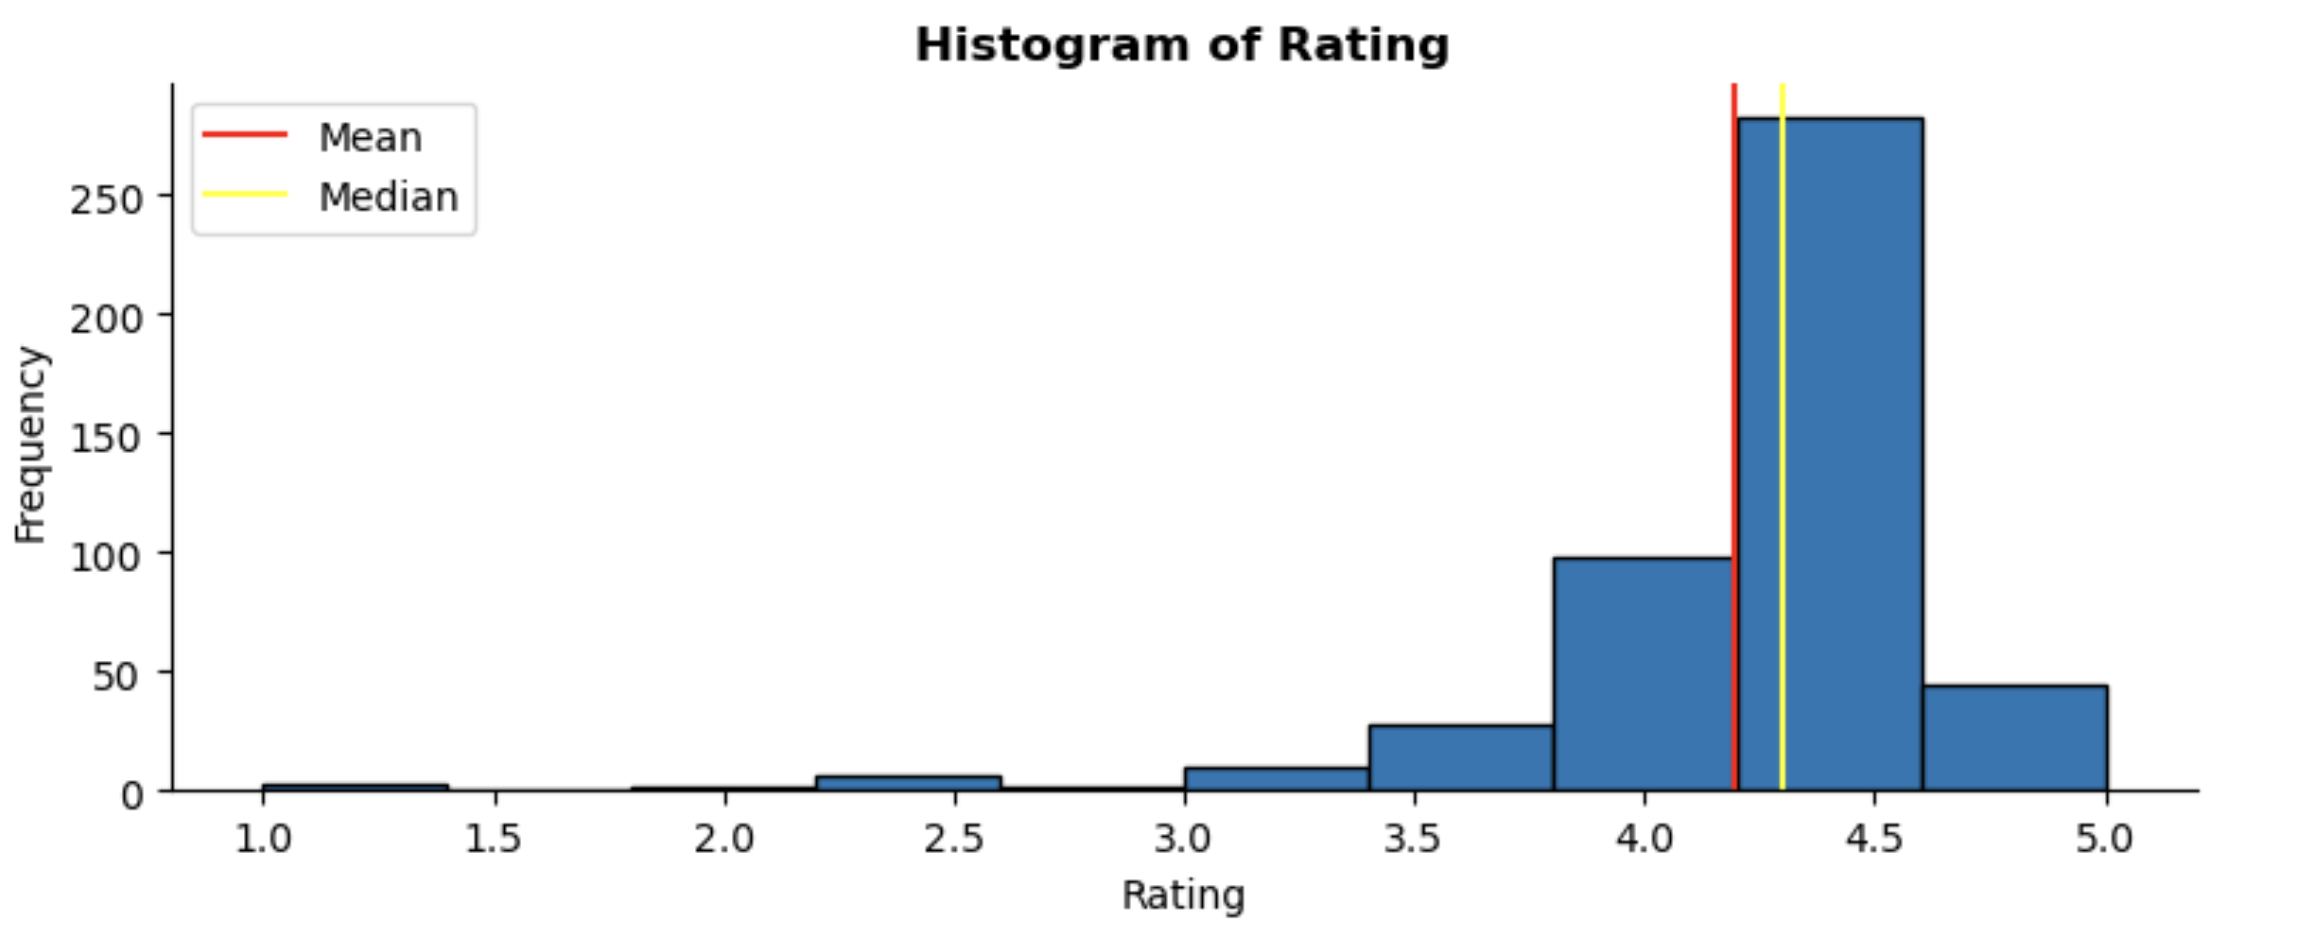
The ratings data is skewed to the left, showing that most headphones receive high ratings from users. I’ve decided not to transform this feature as it reflects genuine user satisfaction. As stated above, models do perform better with normally distributed features however since I plan to build a recommender system, I thought it best to keep the ratings as they are.
Is Prime:

There is a clear class imbalance, with most headphones being eligible for Amazon Prime. Since this feature is so common in the dataset, it may not add much value in differentiating between products within the recommendation model. However, I think Prime eligibility still is an important feature to users, so I will keep this feature in the model.
Wireless:

There is a more balanced split between wired and wireless headphones in the data. Given that some users may prefer the convenience of wireless headphones, including this feature in the recommendation system is a good idea.
Noise Cancelling:

There is a strong class imbalance with noise-cancelling headphones, as most headphones in the dataset do not have this feature. While this could potentially bias recommendations towards non-noise-cancelling options, I’m building a content-based recommendation system. This method allows users to specify their preferences, and the model should prioritise relevant products regardless of imbalances.
Microphone:

See more of a balanced split between headphones with microphones and those without. Headphones with microphones are useful for work or gaming purposes, this is something I can incorporate into my recommendation system.
Gaming:

Strong class imbalance for gaming-specific headphones, in the dataset there are only 30 products featuring ‘gaming’ in their descriptions.
Colour:
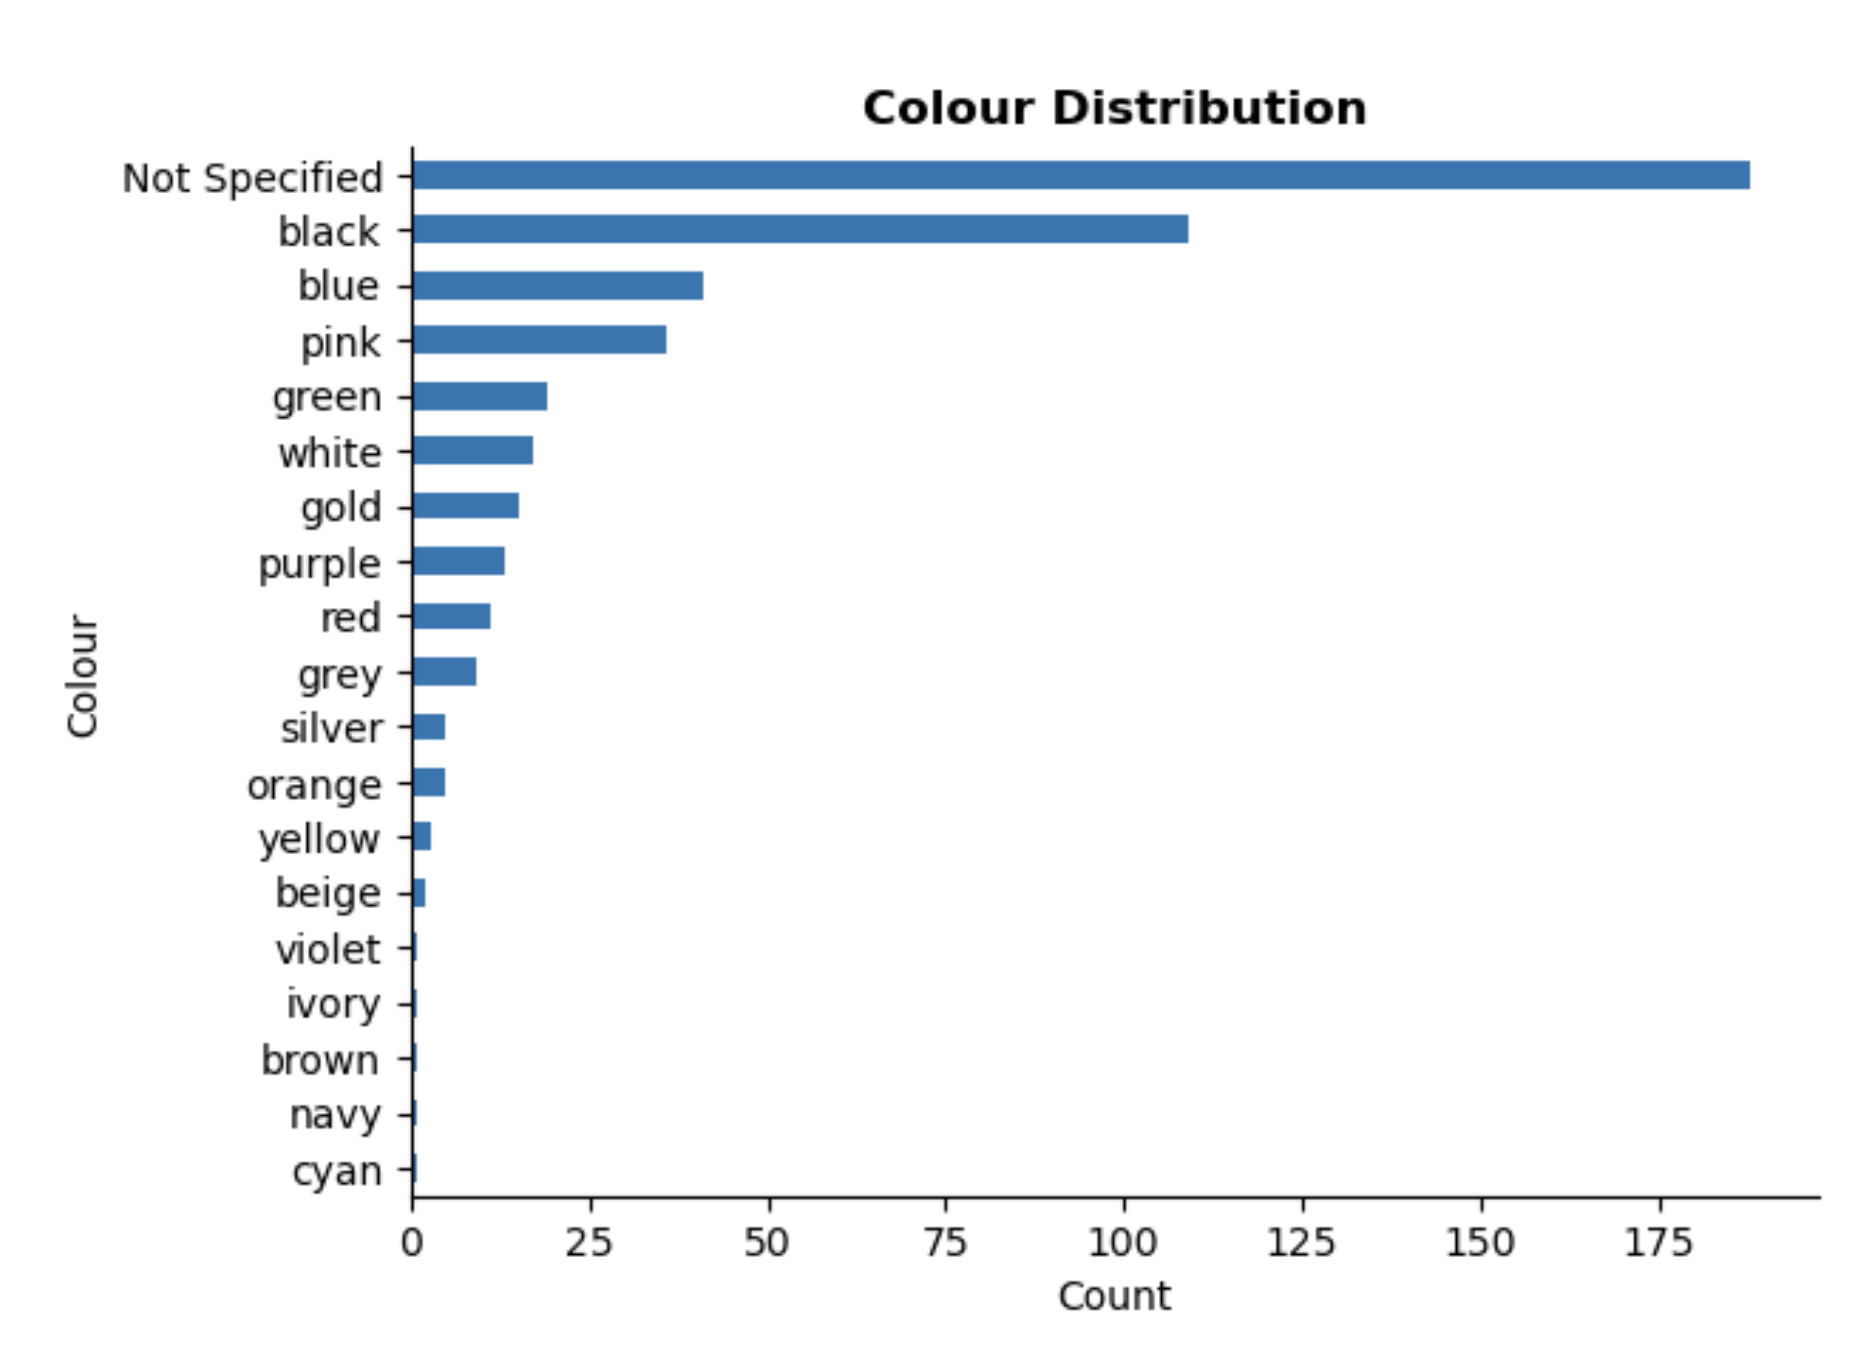
The graph shows the distribution of headphone colours in the dataset. Many headphones lack colour in their product descriptions, likely because this detail is usually included on individual product pages that were not scraped.
The most frequently colours are black, blue and pink. To simplify the dataset for modelling, I grouped less common colours, such as yellow and orange, into an “Other” category. This avoids creating an overly large dataset when encoding the Colour feature.
Since a large number of headphones do not have a specified colour, I will need to consider how to incorporate this into my recommender system. One possibility could be allowing users to select “no preference” for colour.
Multivariate Analysis
Pair Plot
For the pair plot below I only selected the following numerical fields in the dataset: rating, transformed price and battery life. This type of plot, created using the Seaborn library, helps visualise any relationships or correlations that may exist between these features.
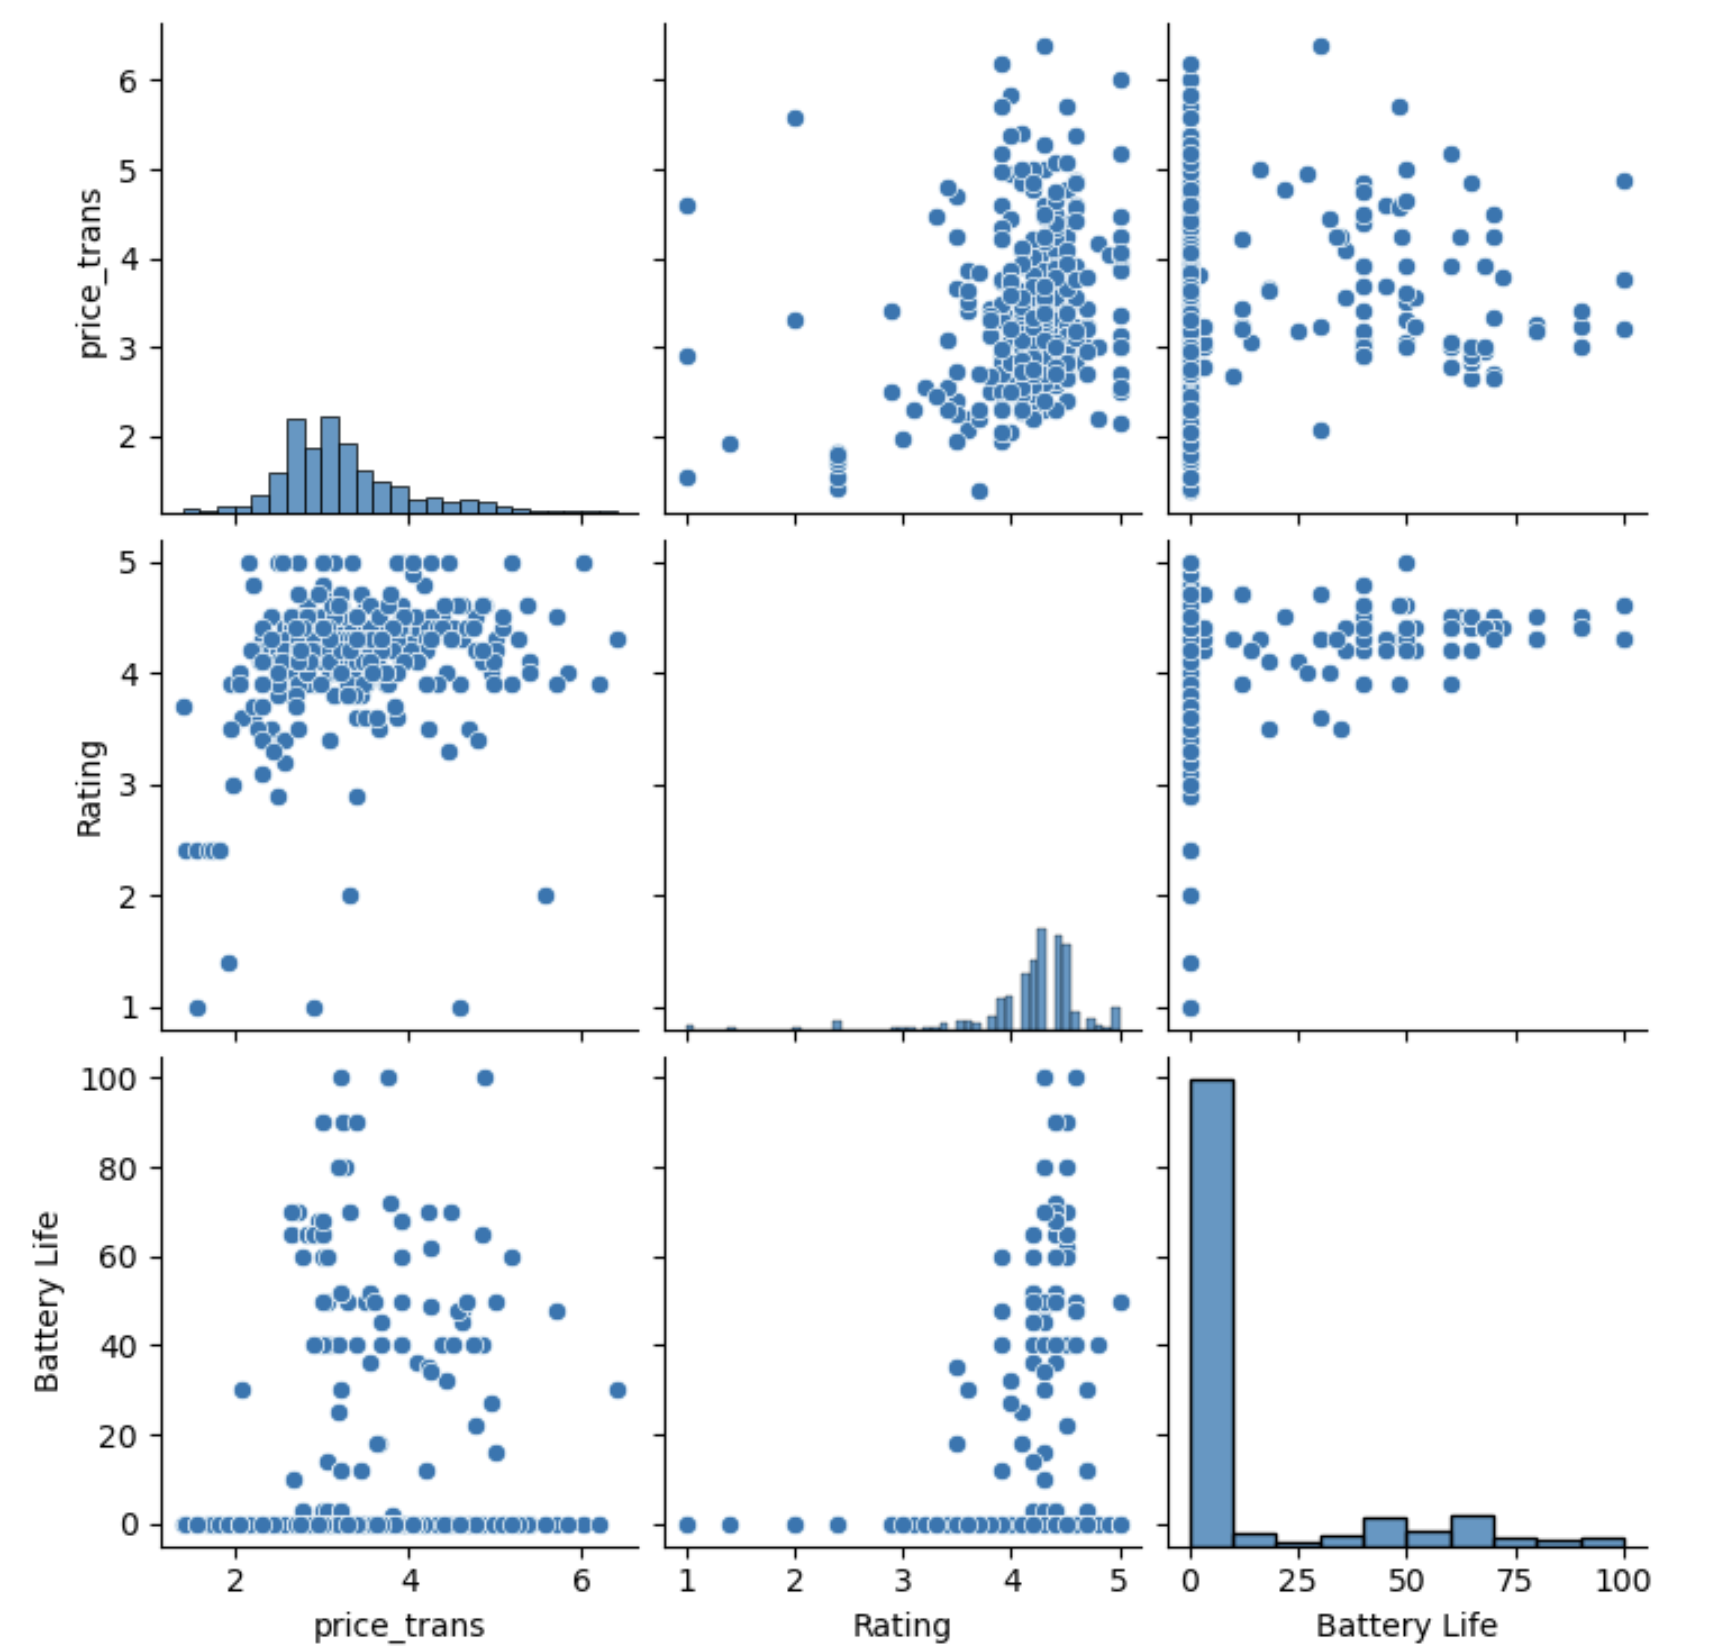
It is clear there are no strong linear correlations between the features. This suggests that these features are independent to each other.
This lack of correlation may stem from the limitations of creating a dataset through web scraping. Amazon may have algorithms that influence which products are displayed in search results, potentially introducing biases into the dataset.
Box Plots of Boolean Features Against Price
Is Prime:
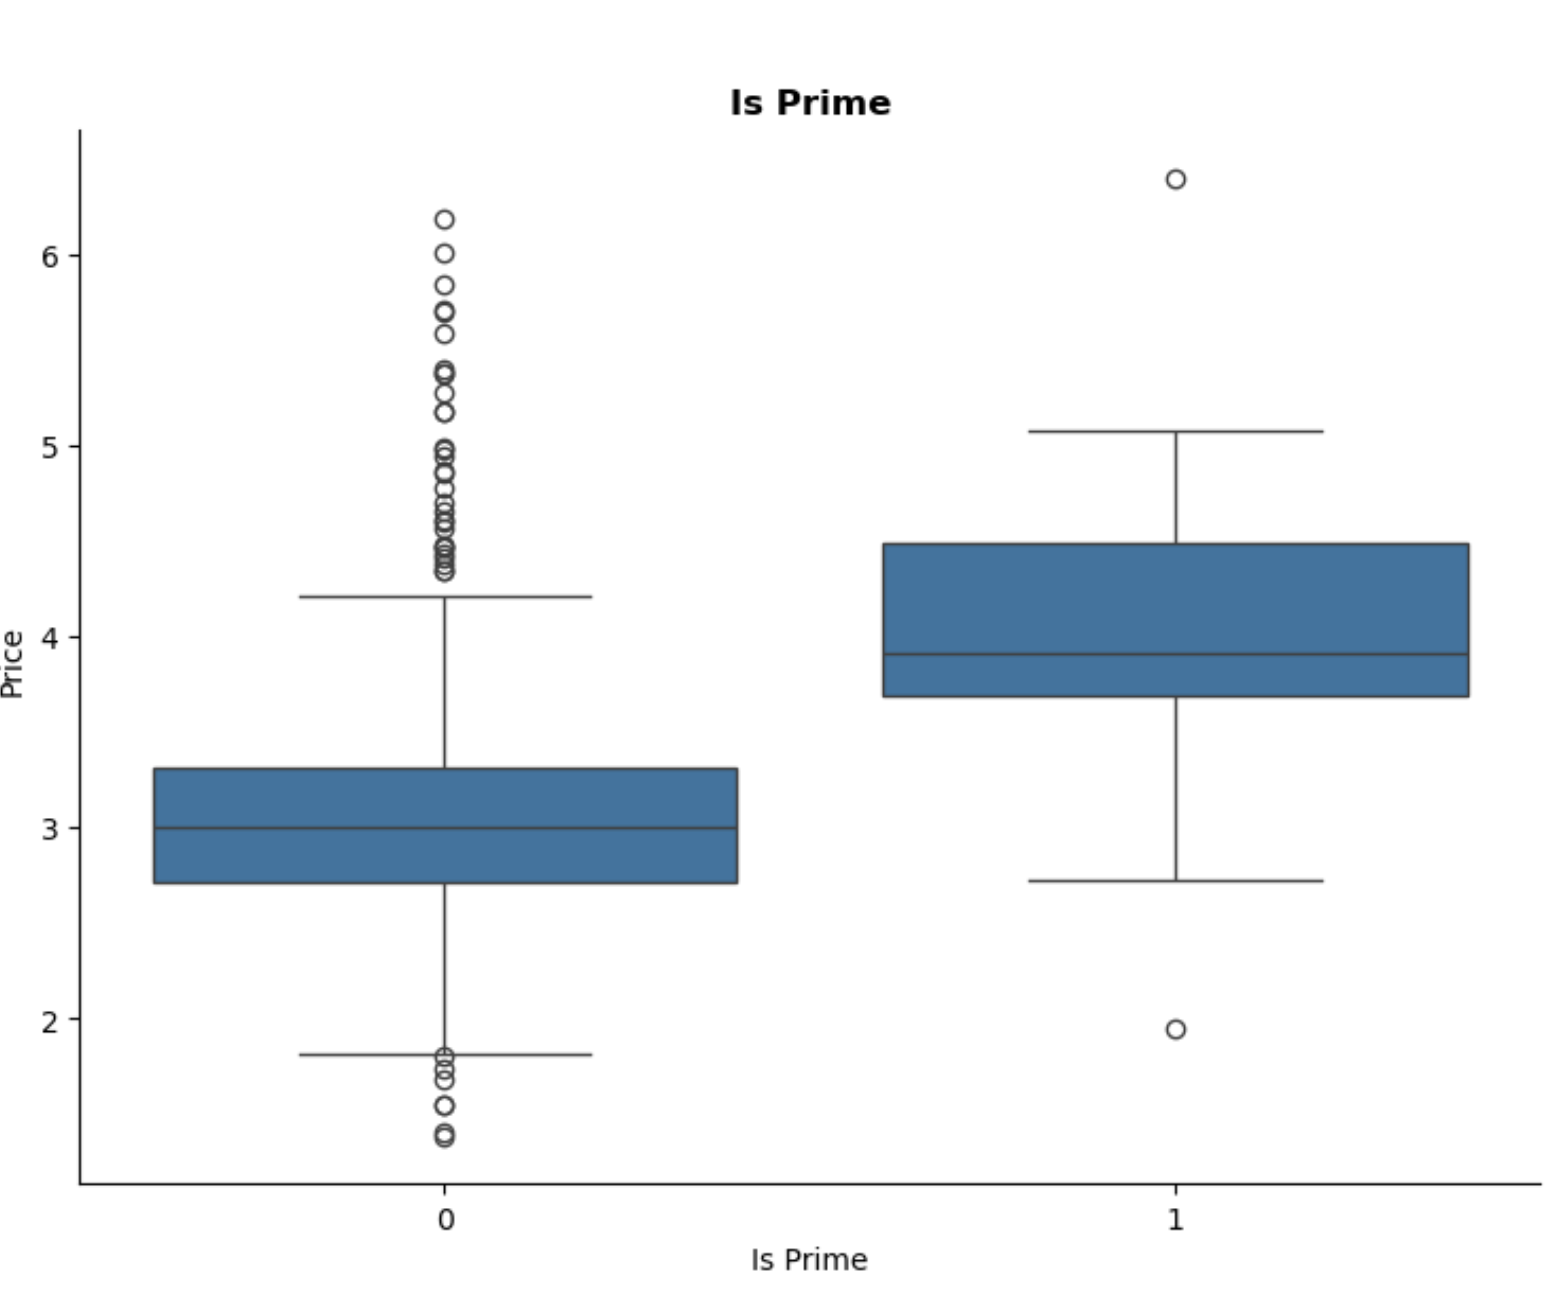
Prime products tend to be more expensive on average, with more outliers in non-Prime products.
Noise Cancelling:
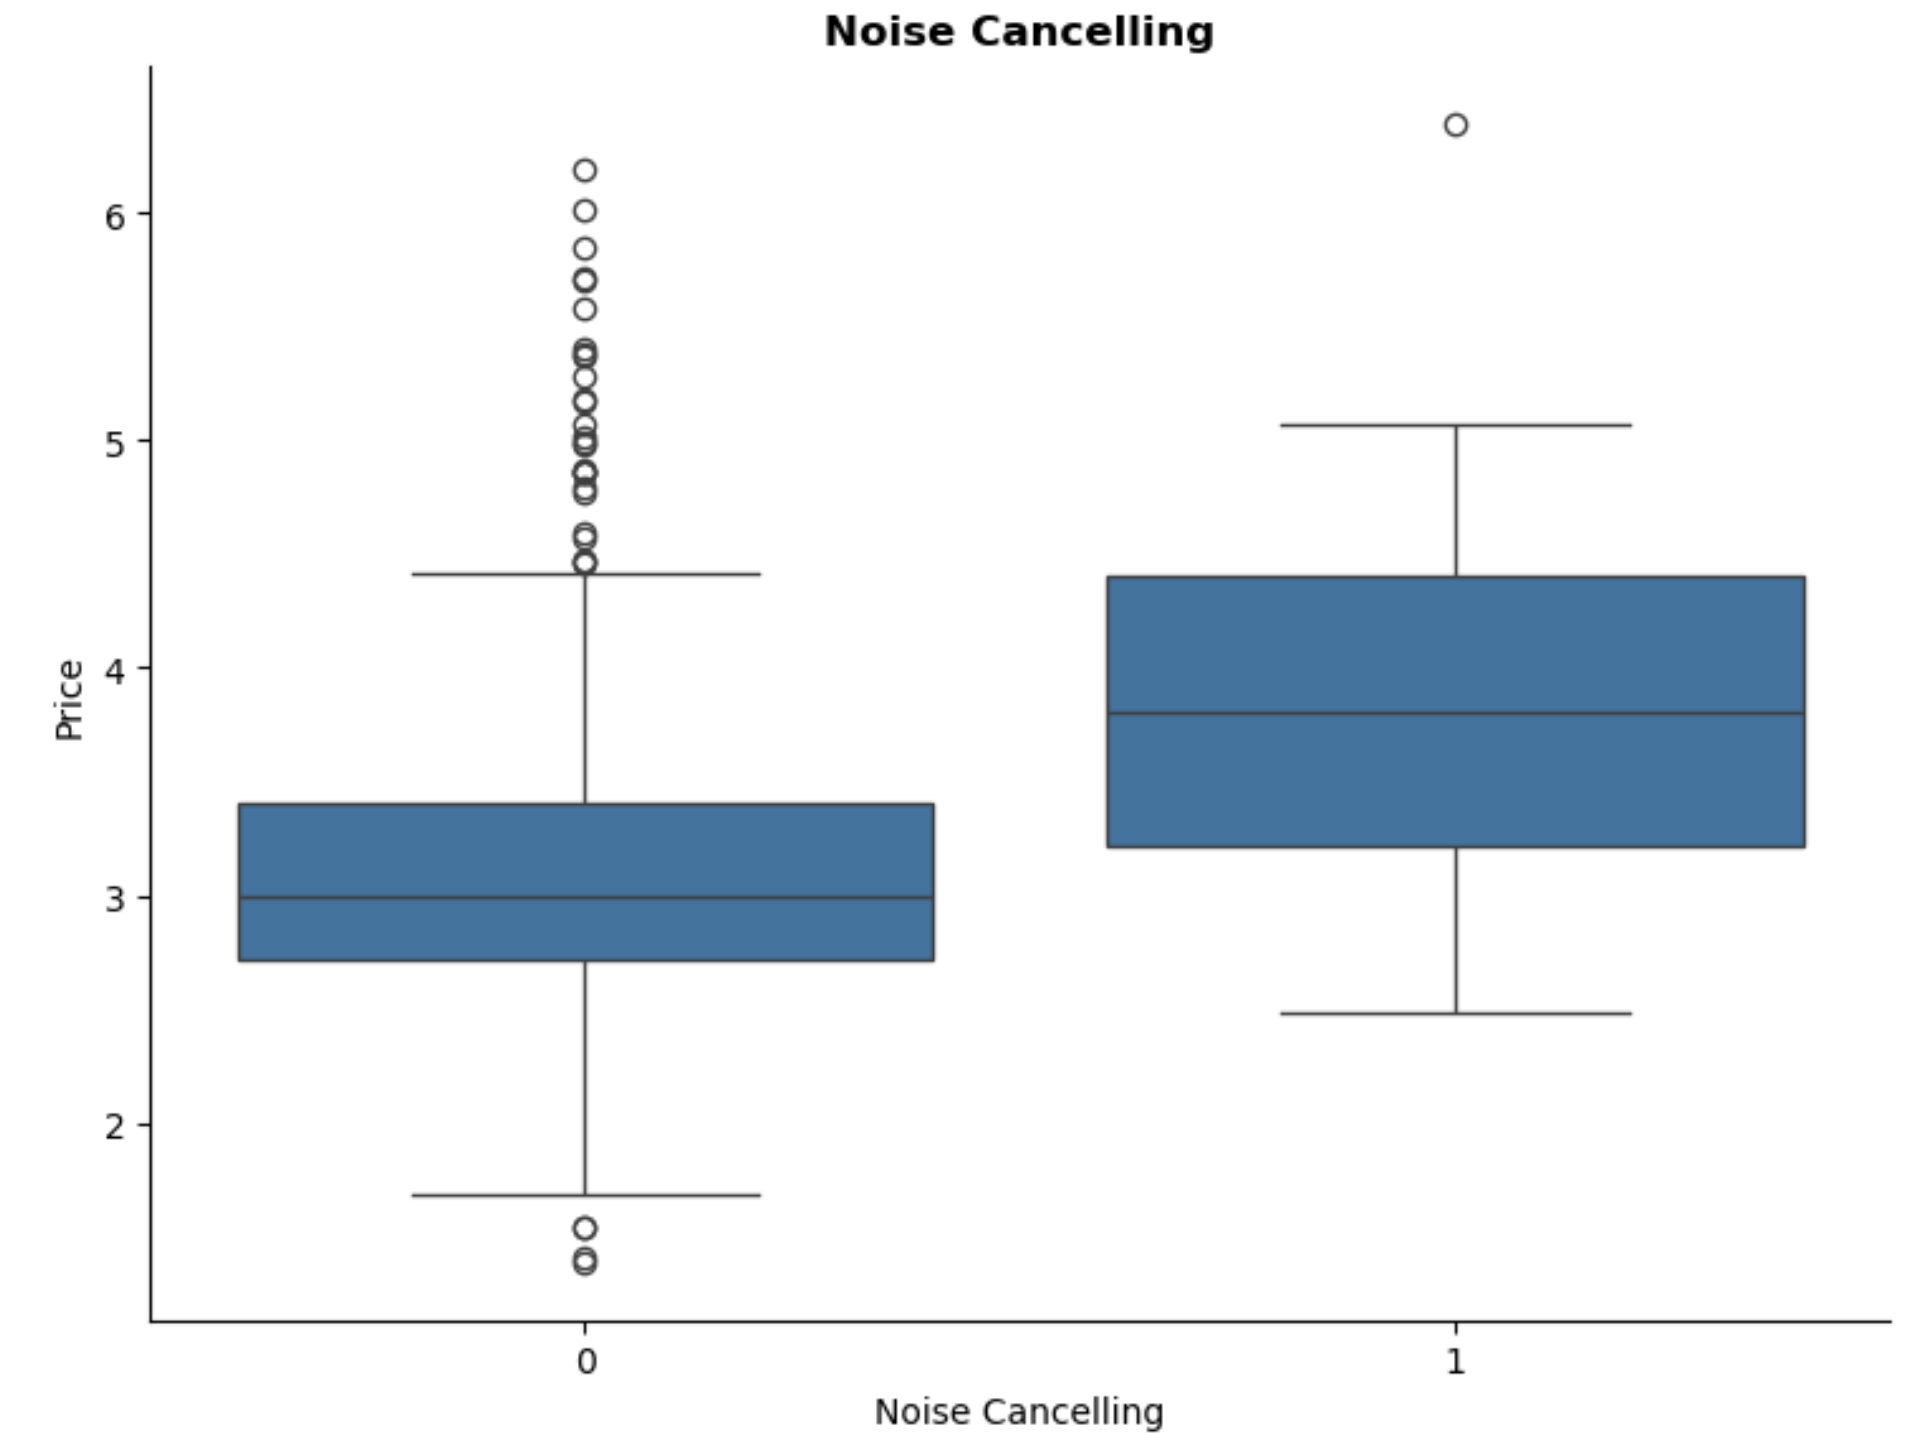
Noise-cancelling headphones are also generally more expensive, indicating that this feature could be considered as a premium feature.
Users who value sound quality or are wanting headphones for working purpose are likely appreciate this feature.
Microphone:
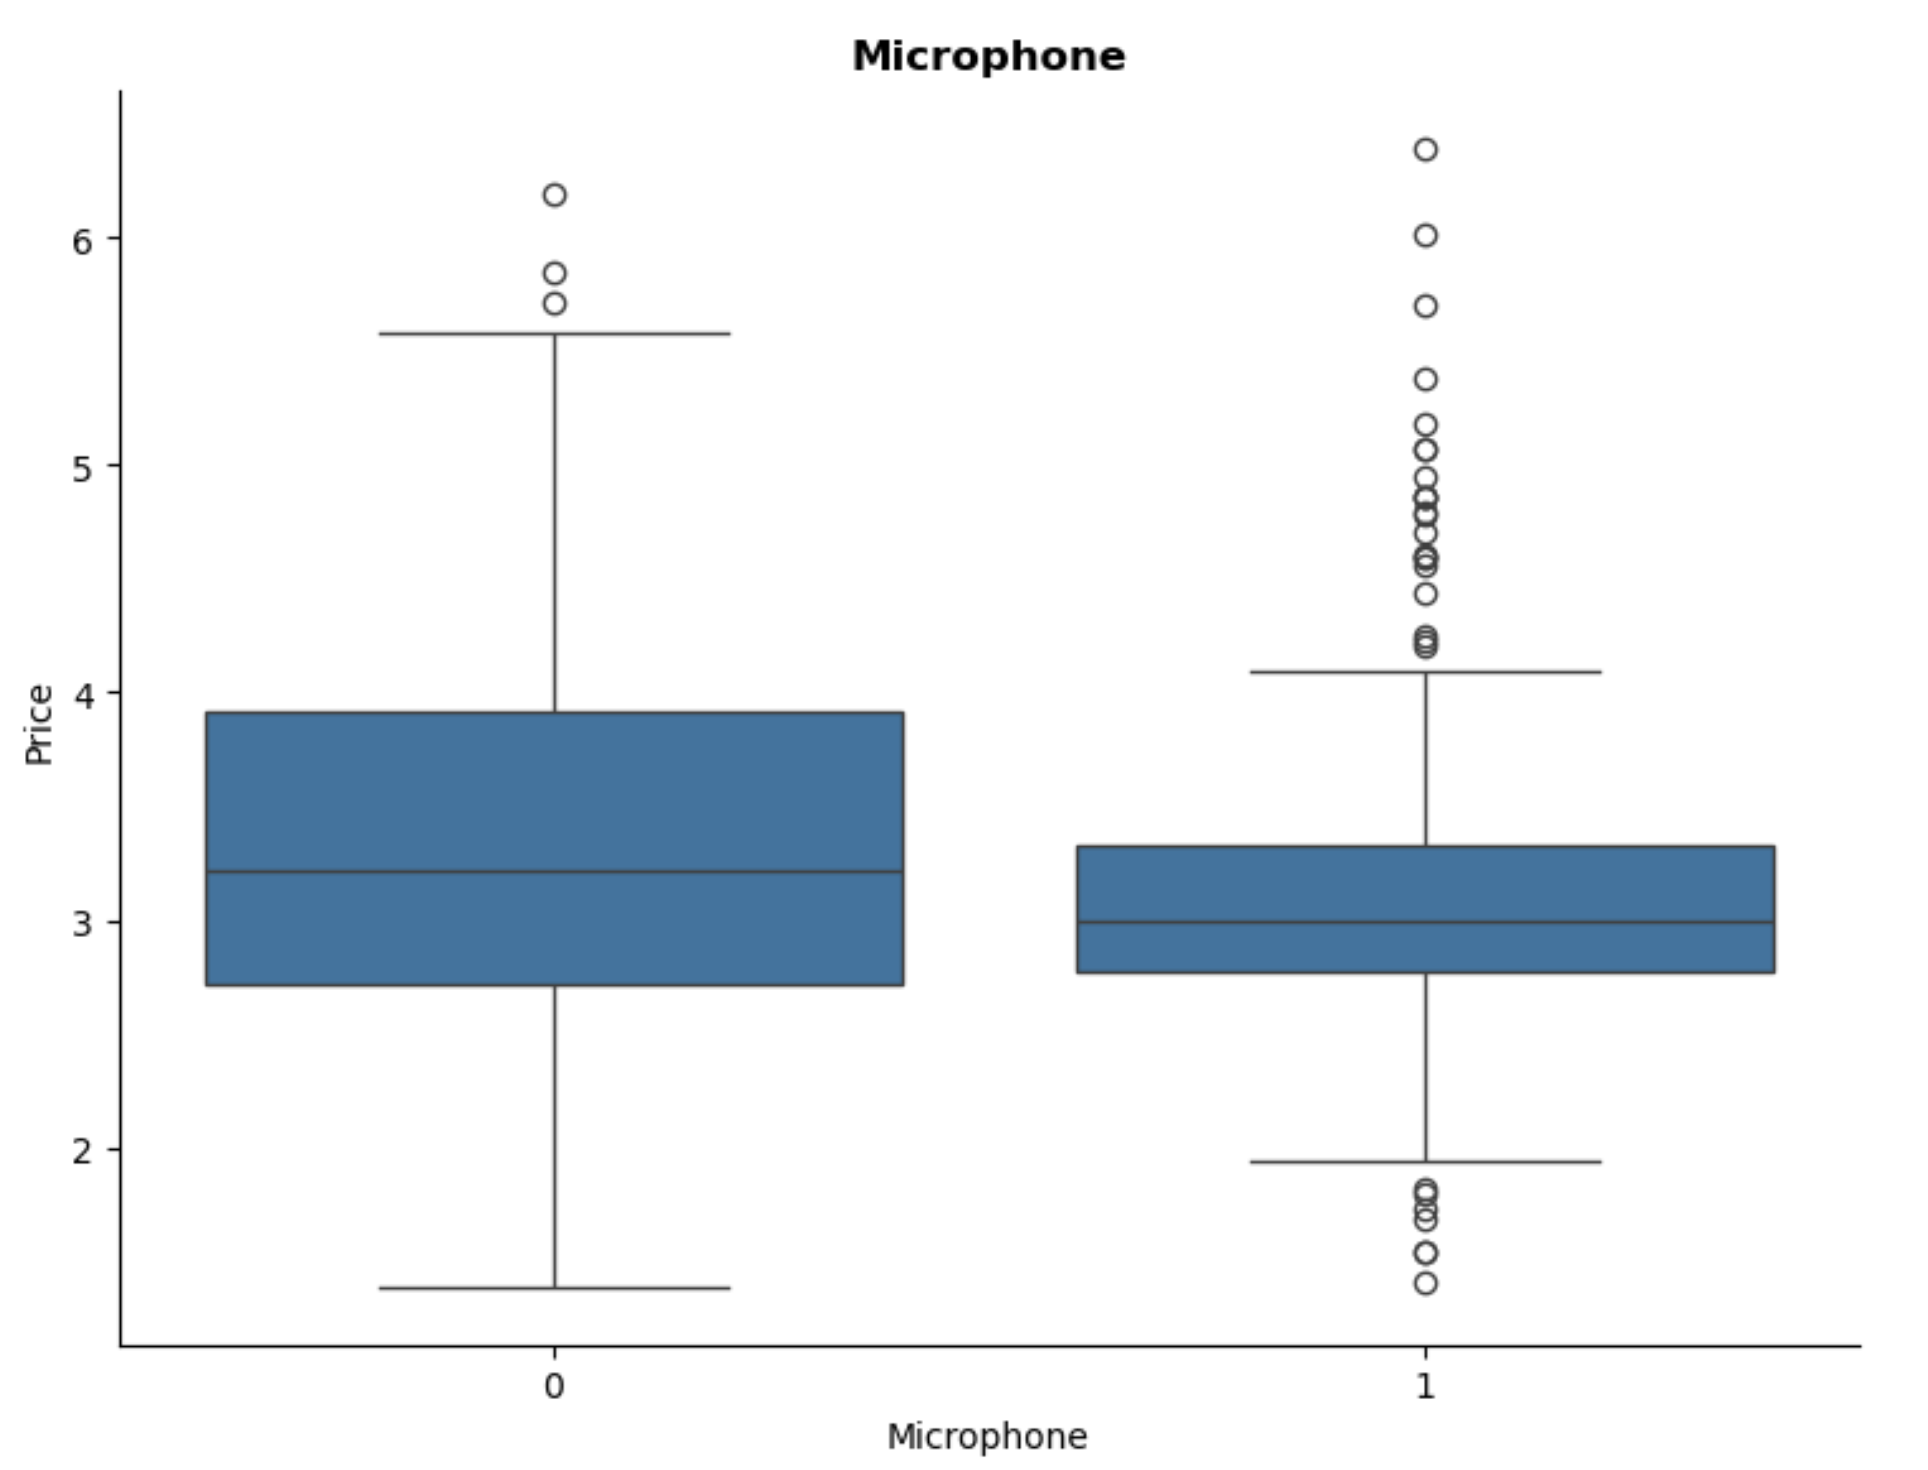
Interestingly, headphones with microphones tend to be slightly cheaper than those without. This suggests that maybe other features may have greater impact on the price than the presence of a microphone itself.
Correlation of all Features with Price
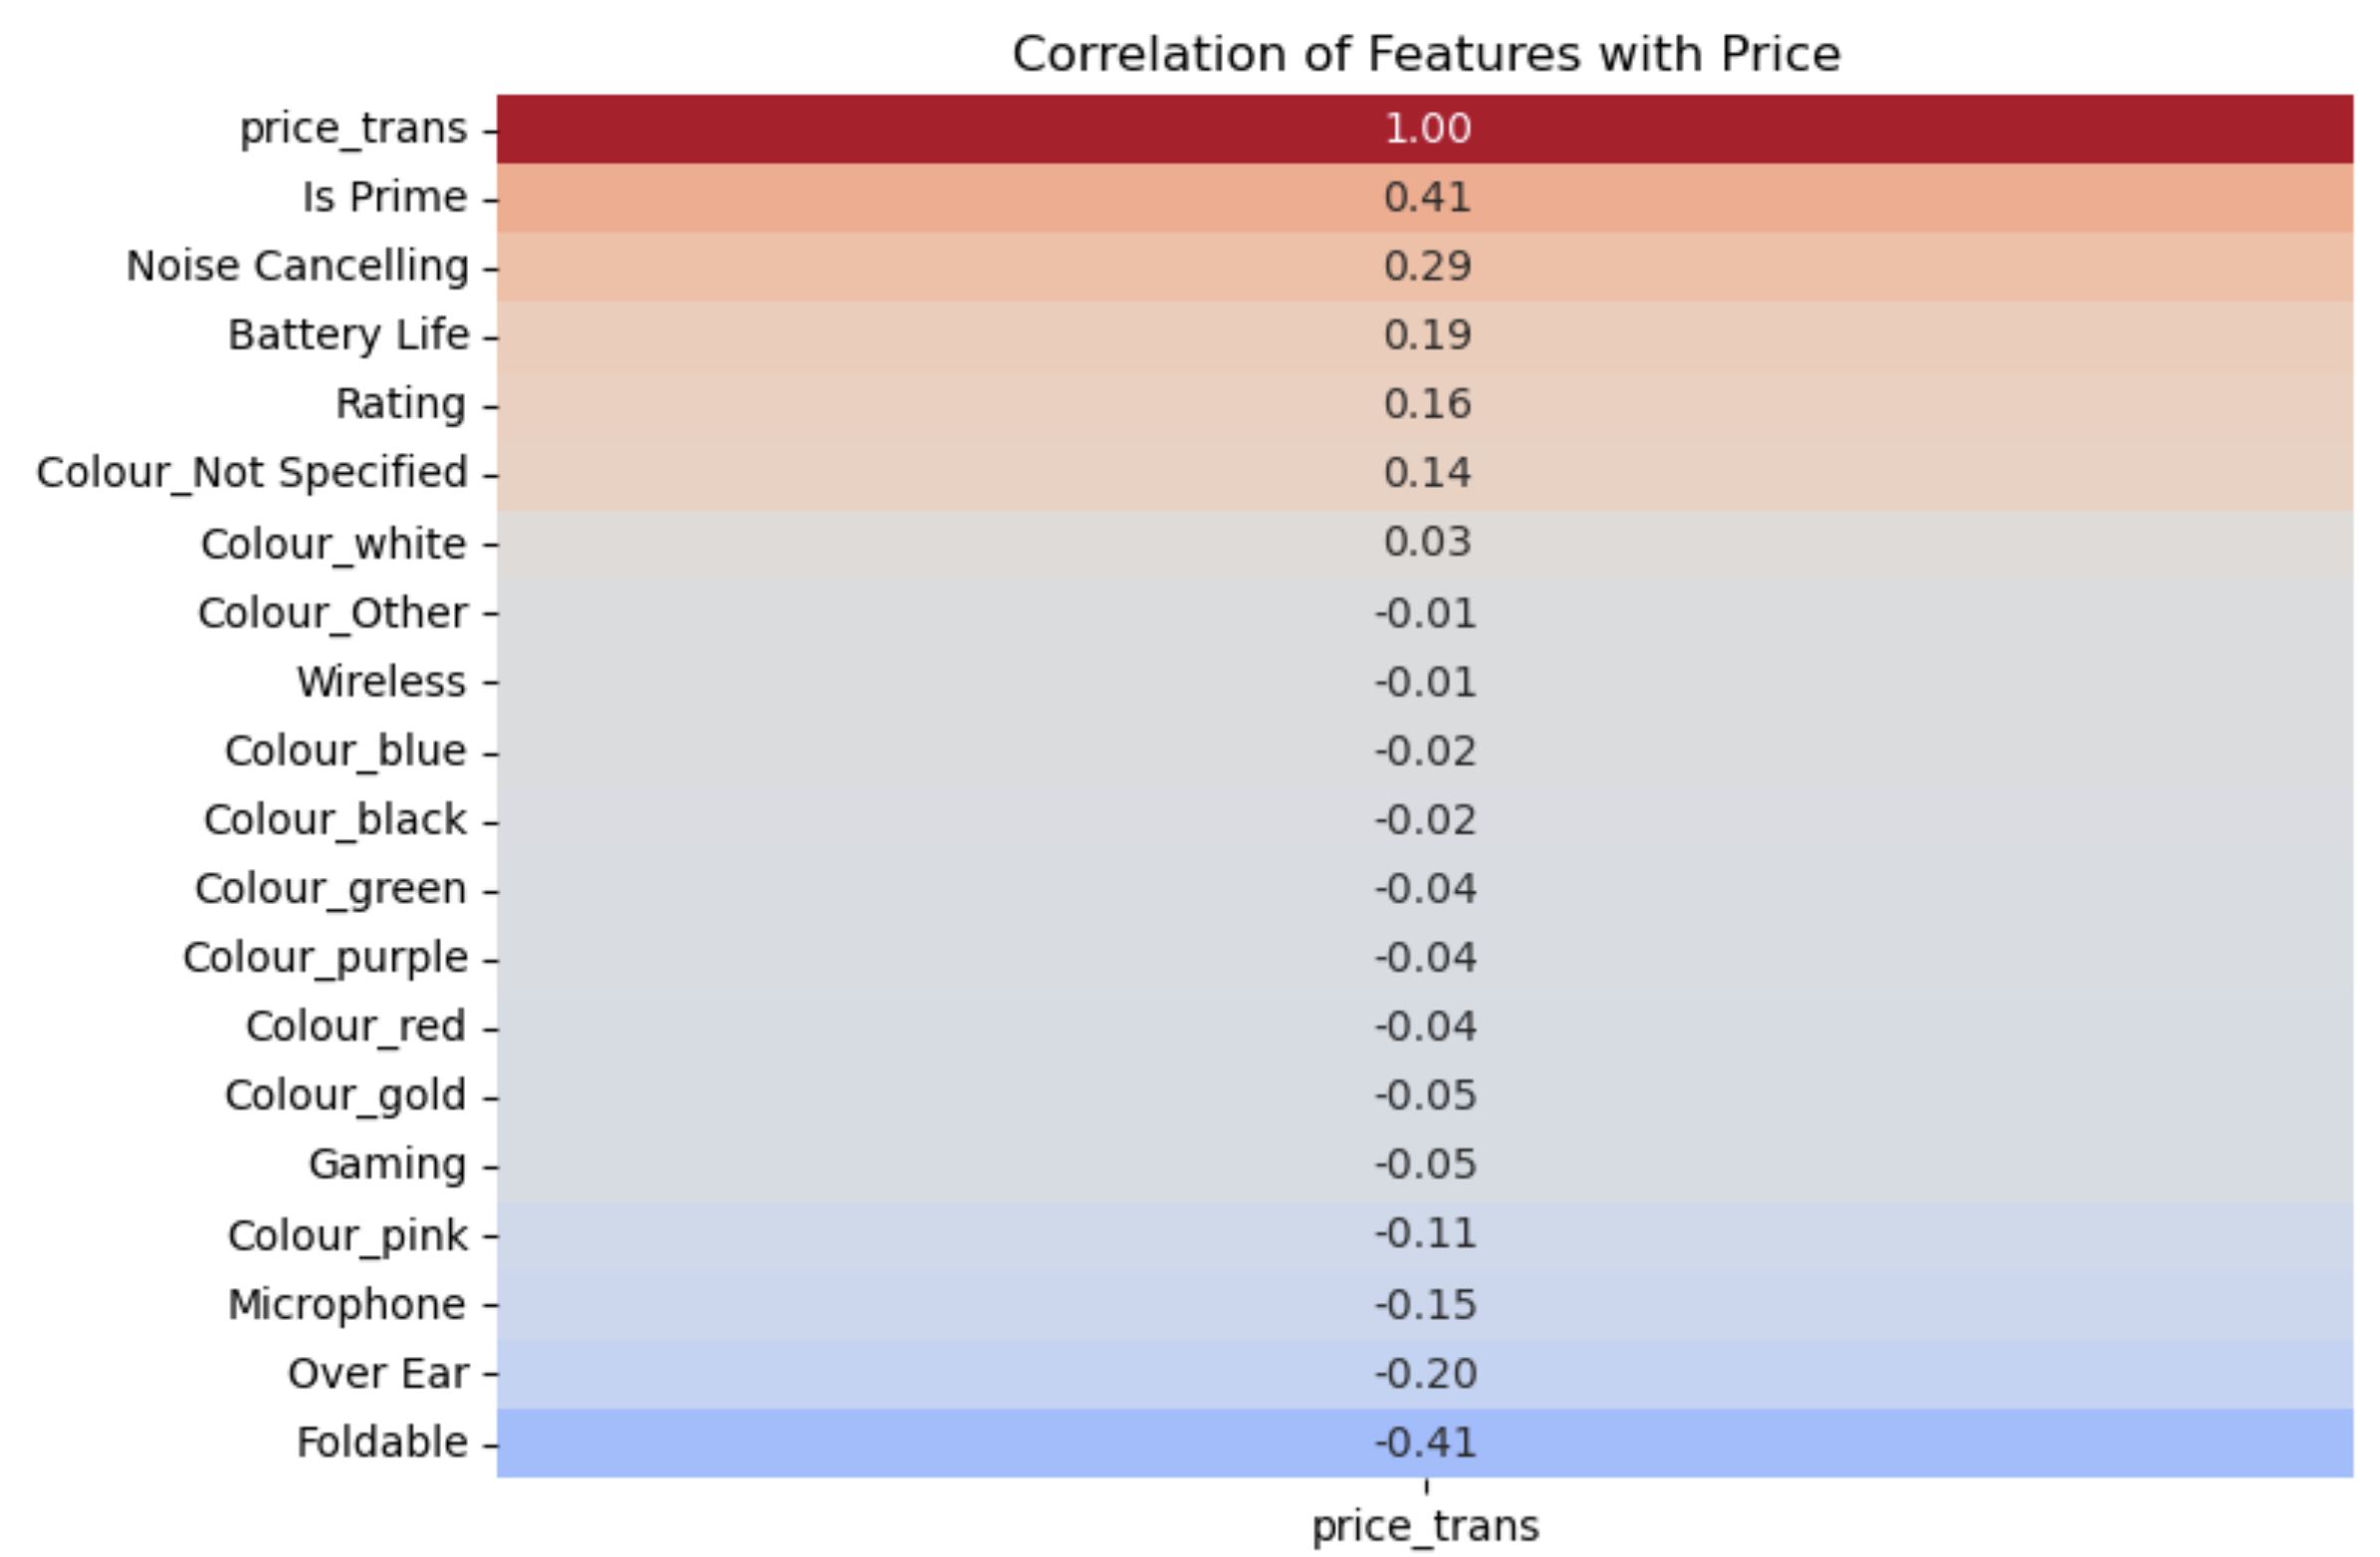
Key Insights:
Is Prime:
Shows the most significant positive correlation with price. This suggests that Prime products tend to be more expensive on average, perhaps due to better service or faster delivery.
Noise Cancelling:
Also shows positive correlation with price. This again suggests that noise-cancelling headphones are often considered premium products.
Over Ear and Foldable:
These features show negative correlations with price. This might suggest that over-ear headphones and foldable models are generally less expensive, possibly reflecting some market trends.
Minimal Influence of Colour:
The encoded colours also show a weak correlation with price, indicating that the colour of the headphones has little impact on their price.
Analysis Limitations
The insights in this analysis are based on features extracted from product descriptions. Since headphones often have multiple features, no single feature fully determines price or rating. Instead, a combination of features likely influences any outcomes – this should be considered in the recommendation model.
Additionally, since my feature extraction relies on these product descriptions, it means that my insights might not fully capture the entire headphone market. So, for this project, I assumed that the data scraped from Amazon provides a reasonable representation of the current headphone market.
Summary
After completing EDA and uncovering key insights, the next step is to build a recommender system. While the EDA highlighted some limitations in the dataset created from scraping Amazon, some insights were valuable. These findings will help in the next phase of the project, particularly in feature selection and data preparation.